
2022 Annual Survey: Industry Reports Steady Occupancy Rates and Higher Expenses
Published on March 5, 2023


Editor’s Note: The Marina Dock Age Annual Marina/Boatyard Trends Survey was opened through the fall and early winter of 2022. We have combined our previous Operations Survey with Trends for an expanded view of marina/boatyard operations. Respondents from across the country answered questions about their facility, operations, revenues, profits, and more.
Respondent Profile
Figures 1 through 1H provide an overview of survey respondents. Fig. 1A reflects the popular boating states with Florida, New York, and Virginia having the most marinas participate in the survey, and the east coast overall providing more data than other areas of the country. Fig. 1B shows that the majority of respondents, 46%, were strictly in-water slip marinas, while 37% identified as marinas with a boatyard or service. As is typical for the results of this survey, the majority of responding marinas were privately owned (83%) and operated (76%).
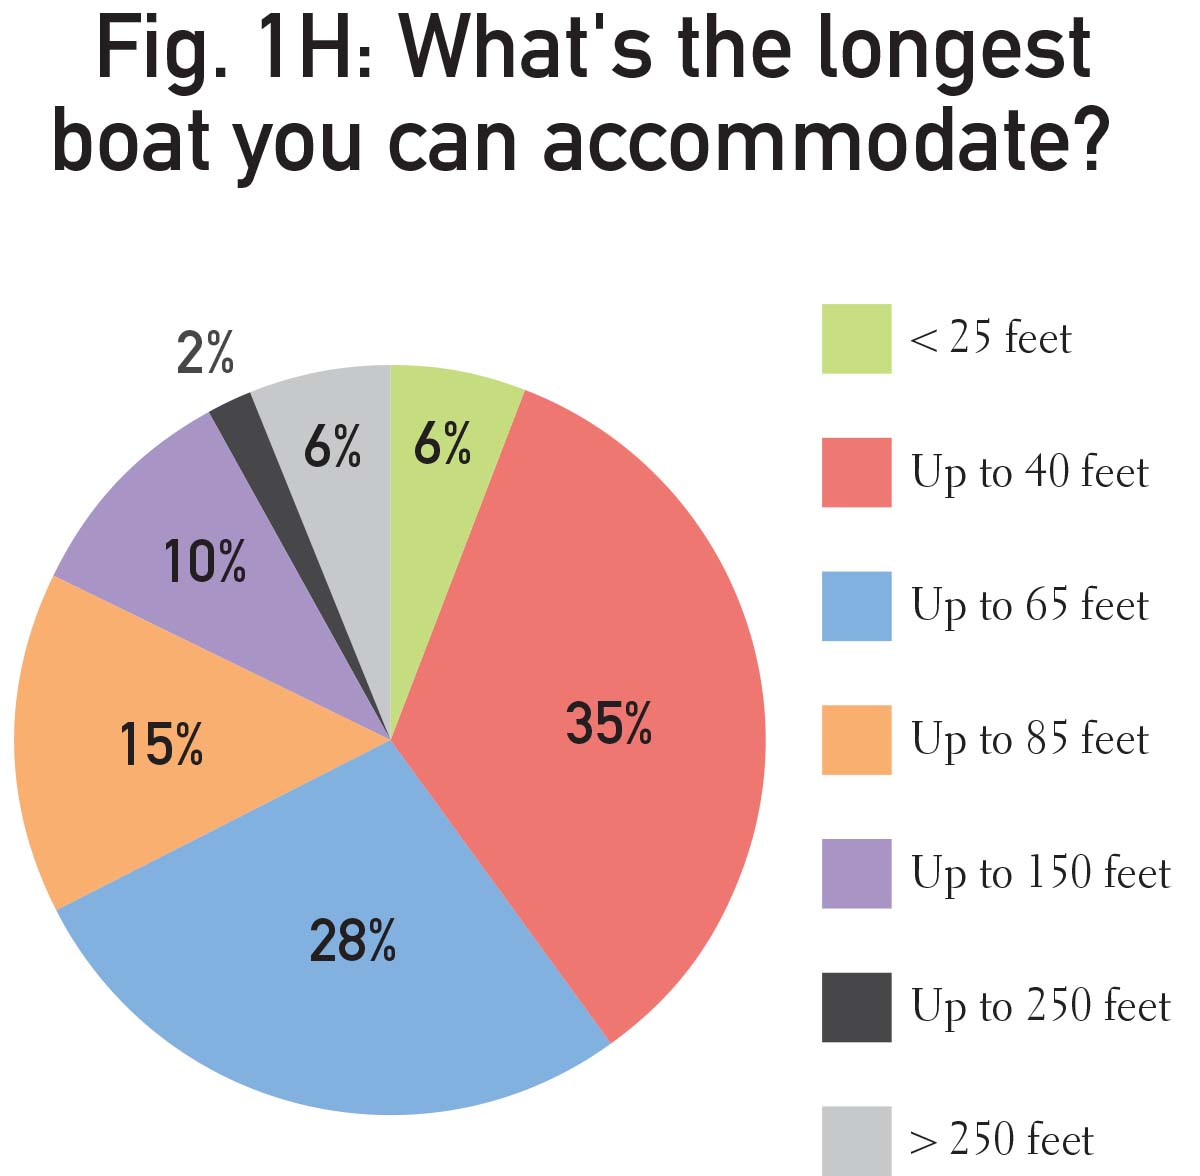
For the first time in the history of the survey, all respondents were small marinas with under 100 slips, shown in Fig. 1E. The majority of marinas responding were 26-75 years old (59%), while the rest were fairly evenly mixed between older than 75 or younger than 25. Owners tend to stick around as reflected in Fig. 1G, with 54% of respondents indicating the current ownership had been in place for more than 20 years. Another 7% had been in place for more than 16 years. Matching to the smaller size of marinas, 69% stated the longest boat they could accommodate was under 65 feet, although 6% could dock vessels larger than 250 feet.
Occupancy and Rates
Just 6% of marinas reflected lower occupancy in 2022 than in 2021, as seen in Fig. 2A. While the rest either remained the same (50%) or had higher occupancy (44%). Fig. 2B shows 67% of respondents had occupancy rates in 2022 of 95% or greater and just 5% reflected rates lower than 50%.
As depicted in Fig. 3A, respondents were nearly evenly split over whether their slip rates increased (49%) or remained the same (51%) over their 2021 rates. Similar to slip rates, service rates for responding marinas were split between increasing or remaining the same year over year.
Reflecting the country’s inflation, Fig. 3C shows 85% of marinas saw their total expenses rise from 2021, with no one seeing a decrease. Despite the rise in total expenses, 43% of respondents saw their gross profits rise as seen in Fig. 3D, while just 21% faced a decrease in profits year over year.
Operations and Structures
Fig. 4 depicts operating challenges faced in 2022. Marinas cannot avoid natural disasters and this past year saw a fairly widespread impact from all natural disasters with about 8% of respondents experiencing structural damage from hurricanes and tropical storms. Another 36% faced everything from flooding or low water levels to wind and ice storms.
Fig. 5A reflects structures at the facilities that were not original and when they had last been renovated. Wifi was the most recently renovated with a full 93% indicating it has been redone within the past five years. Overall, most structures had been renovated within the past 15 years indicating marinas are continuing to modernize to meet demand.
Fig. 5B asked how long original infrastructure has been in place at the marina. In response to boater demand, Wifi, laundry rooms, fuel, and pumpouts were most likely to have been installed within the past five years. More complex in water infrastructure was most likely to have been in place more than 40 years.
Training and Expenses
Fig. 6 identified different operations for marinas, and if and how often employees are trained for these operations. For the majority of services, marinas choose to do annual training for their employees, although just over 45% do not train on fuel dock or pumpout operations.
Fig. 7 explores the line-item expenses of marinas and how they compare to the previous year. Insurance, maintenance, and utilities were most likely to have gone up, while more discretionary expenses of training, travel, and education remained the same.
Fig. 8 questioned how different revenue streams changed year over year. Since the pool of respondents were smaller marinas, many did not have all of the services listed. Storage and service revenues were most likely to have increased or stayed the same.


| Categories | |
| Tags |