How Vulnerable is Your Marina? What to Know
Published on April 28, 2025


Editor’s Note: This article is the second in a series of three articles that discuss the objectives, practical implementation and benefits of creating “Resilient Marinas.” In the July/August issue, the third article will explain how a vulnerability assessment can be used to reduce risk, develop Severe Weather Preparation Plans, optimize future development and incorporate resilient design of marina structures and systems.
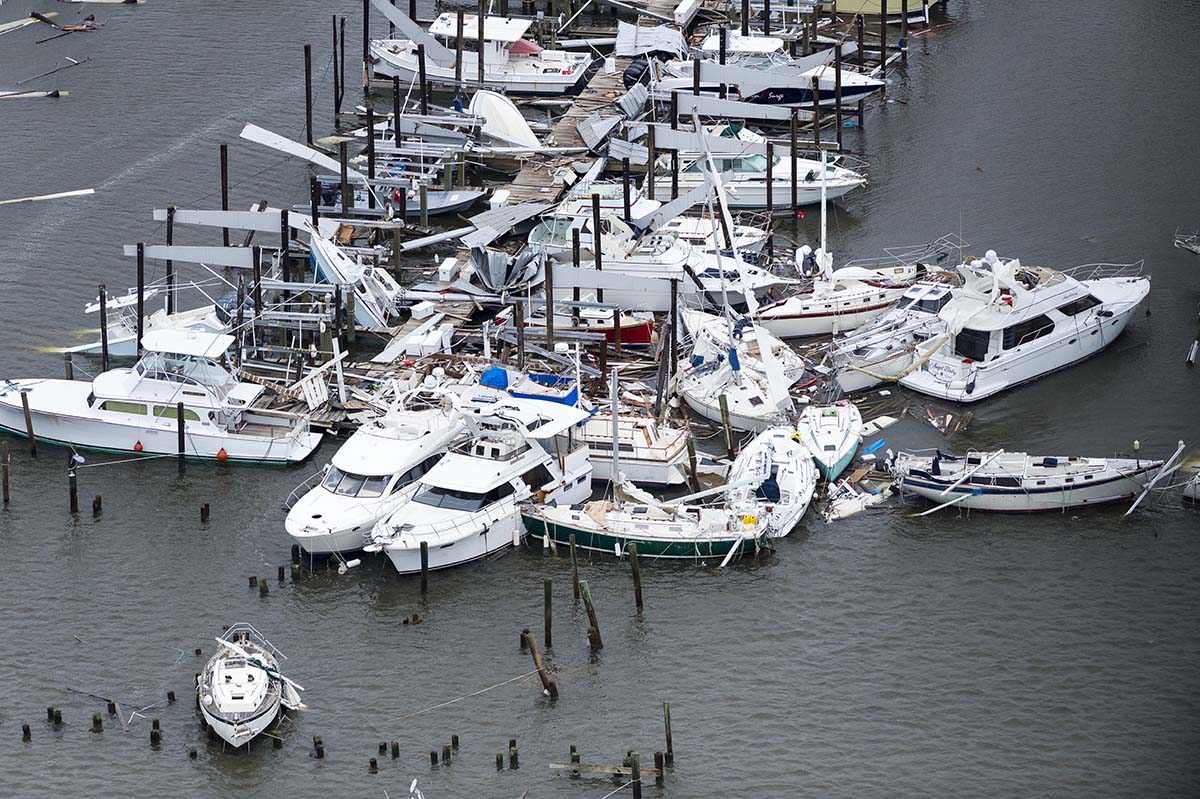
Marinas are exposed to severe weather, including high winds, intense precipitation, flooding, waves and hail and lightning. These severe weather events can result in flood inundation, rain infiltration, exposure to hydrostatic, hydrodynamic, wind and wave loads and occasionally hail damage and lightning strikes. The vulnerability of marina assets and customer vessels to damage from these conditions is a function of the marina coastal setting and exposure; the design of the marina structures and systems; and the operational capabilities available to reduce damage (e.g., creating and implementing Severe Weather Preparation Plans). When damage is substantial, marina owners, operators and customers are left with the difficult, long and costly process of recovery, including salvage, demolition, debris management, insurance claims and reconstruction. Therefore, marina owners and operators should know in advance what their marina vulnerability is and what measures can be taken to reduce the associated risks.
Assessing marina vulnerability is the first step toward achieving a Resilient Marina. The vulnerability assessment is typically performed by a qualified coastal and waterfront engineer.
Step 1: Characterizing the Coastal Hazards
The first step is to characterize the coastal storm types and environmental conditions that apply to a marina’s location.
The storm types impacting marinas differ by location but typically include tropical storms and hurricanes; extratropical cyclones, which are major weather events in the Great Lakes, the Mid-Atlantic and New England (nor’easters); and single cell to mesoscale thunderstorms. Each storm type produces environmental conditions that can last from a few hours to several days.
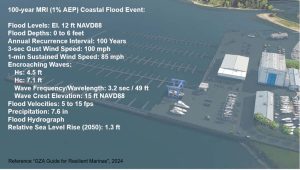
Environmental conditions typically include intense wind; intense precipitation; elevated flood water levels; and large waves. Long-term changes to future water levels, such as sea level rise, are additional factors. Each of these conditions is evaluated based on their likelihood of occurrence, specifically their annual exceedance probability (AEP), which is the probability that the condition will be experienced or exceeded in any given year. A similar term often used to present the same probability is the mean recurrence interval (MRI). For example, the 1% AEP flood level is the water level that is predicted to have, in any given year, a 1% chance of being experienced or exceeded. This is also known as the 100-year MRI water level. Each of these conditions will also be specific to the marina location and coastal setting.
Wind speeds are characterized in terms of a three-second gust, a one-minute sustained wind speed and a 10-minute sustained wind speed. The predicted wind is characterized directionally or as an “all direction” wind speed, corrected for elevation, exposure and surface roughness (e.g., over water or over land). Precipitation is characterized in terms of intensity over defined rain durations; for example, the 100-year MRI, 24-hour precipitation intensity at a certain geographic location might be 8 inches. Flood water levels and ground and structure elevations are referenced to a geodetic elevation datum such as the North American Vertical Datum of 1988. Waves are characterized in terms of height, period and wavelength for waves encroaching on the marina but outside of any wave attenuation features; waves within the inner harbor at the piers and docks; and overland waves associated with flood inundation.
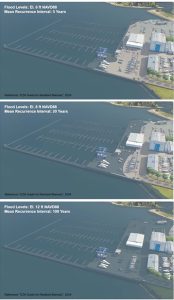
Figure 1 shows examples of coastal flooding at a typical marina for different
probabilities, including five-year, 20-year and 100-year MRI floods. The top image indicates that, in this example, overland flooding is likely to occur starting with the five-year MRI coastal flood, meaning that in any year the marina has a chance of flooding of about 20%. Over 10 years the chance of experiencing this flood at least once is about 90%. The bottom two figures show much more impactful flooding, although with lower likelihood of occurrence. For example, the 100-year MRI flood (bottom image) shows substantial flooding over much of the marina, resulting in extensive damage.
This flood would have a 1% chance of being experienced or exceeded in any year. Over periods of 10 and 30 years, the chance of experiencing this or greater flooding at least once is about 10% and 26%, respectively. This means that this marina would have a 10% chance of experiencing substantial damage and financial loss at least once over a 10-year period. In consideration of the reconstruction costs and other consequences, 10% is a relatively high risk to the marina owner, and measures to reduce the risk are warranted and cost-effective.
Although Figure 1 specifically focuses on flood inundation, a complete vulnerability assessment should include all relevant environmental conditions characterized for a range of probabilities, from one-year to 500-year MRI events. Figure 2 shows an example of characterizing all the relevant environmental conditions for the 100-year MRI event.
Step 2: Marina Vulnerability
After establishing the marina’s exposure to coastal storm conditions in Step 1, Step 2 evaluates the marina’s vulnerability and potential for damage. This assessment is best performed programmatically, starting with a comprehensive inventory of marina assets, which are categorized and described with appropriate information. For example, the asset category marina systems may include shore power infrastructure with substations, transformers, distribution boxes, cables, conduits, power pedestals and switch-off mechanisms.
Each asset is evaluated for percent damage over the range of predicted environmental conditions, typically spanning from one-year to 500-year mean recurrence interval (MRI) events. The evaluation can vary from high-level screening to a detailed engineering evaluation.
The following provides an overview of typical damage by marina assets.
Buildings and Accessory Structures
Marina buildings vary from small, timber-framed accessory structures and metal trailers to one to two-story commercial buildings to high bay, pre-engineered marina service and boat storage buildings. A marina may also include recreational buildings for a restaurant or clubhouse. Buildings and accessory structures are vulnerable to flood inundation and rain infiltration, which can damage building materials, building contents and utilities due to wetting, siltation and salt exposure; exterior siding and roofing damage due to wind and high velocity flood flow; and structural damage from wind and wave loads. Overland flooding of marinas occurs primarily due to storm surge but can also include effects of stormwater. Intense winds can result from hurricanes, tornadoes or mesoscale convective storms.
Building damage from wind is due to differential pressures acting on the building envelope, which includes roofs and walls and their associated components, and wind-borne debris that may strike a building. Figure 3 presents predicted damage due to different hurricane categories and wind speeds.
In the absence of waves, buildings exposed to flood depths greater than 1 to 2 feet above the lower floor elevation will start to experience significant damage. The presence of waves substantially increases the damage potential. Wave heights greater than 1.5 feet (mapped as the FEMA Coastal AE zone) result in structural damage to timber structures, and waves greater than 3 feet (mapped as the FEMA VE zone) can result in significant structural damage to timber structures and damage to other building construction types. It is important to note that FEMA mapped AE and VE zones do not account for future changes due to sea level rise.
Inner Harbor
Inner harbor assets include wave attenuation structures, floating docks and guide piles, fixed docks, gangways, shoreline features such as seawalls or revetments and customer vessels. Wave attenuation structures, including floating wave attenuators, wave fences and breakwaters, act as the inner harbor’s first line of defense, but during significant storm events, they can become compromised through damage or inundation. When waves penetrate the harbor, they can impose excessive loads on floating docks, fixed docks, gangways and piles, resulting in structural damage.
Elevated water levels, combined with wave action, generate buoyant and lateral loads on fixed structures, potentially causing excessive pile bending, displacement or failure and deck failure. Guide piles are essential for stabilizing floating docks, but at high water levels, docks and vessels may float off their guide piles. Once adrift, these docks and vessels become hazardous debris, initiating a chain reaction of damage to surrounding structures.
Additionally, bottom scour due to high flow velocities or filling as a result of sediment transport can cause failure of pile foundations, seawalls and filling of fairways and channels.
The presence of vessels during coastal storm events significantly amplifies the risk of damage to inner harbor assets. Vessels can exert substantial lateral loads on docks and piles due to wind forces and wave-induced motions, such as sway or surge. Additionally, vessel collisions with docks, piles and other vessels pose a considerable hazard. In extreme circumstances, vessels may even be lifted onto docks by wave action.
Wave heights exceeding 3 feet typically cause extensive damage, while maintaining wave heights within the preferred range of 1 to 1.5 feet during storms is crucial for minimizing damage to docks and vessels.
Marina Systems and Utilities
Marina systems include shore power, fuel stations, washdown stations, sanitary pumpout and cranes and lifts. These systems, much like inner harbor structures, are vulnerable to the combined effects of flood inundation, elevated water levels and wave action.
Shore power, including transformers, substations, power pedestals and conduits, are particularly vulnerable to coastal flooding, dock damage and vessel collision, including property damage and hazards like fire, stray electrical currents and electrocution. Coastal flooding may lead to damage to electrical conduits located on docks or along land-water transitions; damage to power pedestals due to waves, spray or vessel impacts; and/or damage to dock-mounted or adjacent land-mounted transformers and distribution panels from flood inundation, waves, spray or vessel impacts.
Fuel systems, including above-ground and below-ground storage tanks, dispensary pumps and fuel lines, are vulnerable to failure of exposed fuel lines located on docks or along land-water transitions; damage to pump dispensers caused by waves, spray or vessel impacts; and flood inundation or wave damage to above-ground storage tanks. Additionally, structural failures of docks and gangways supporting fuel lines and pumps can lead to the breakdown of attached fueling systems. Beyond physical damage, fuel systems are exposed to consequential risks, such as environmental contamination and fire.
Similarly, washdown stations composed of power washers, concrete pads, drains with diversion or shut-off valves, manholes, underground storage tanks and treatment systems are vulnerable to flood inundation and wave damage. Pumpout systems, which include pumps, sanitary lines, storage tanks (above and below ground), municipal sanitary connections and on-site treatment systems, are vulnerable to damage from flood inundation as well as damage to dock-supported components.
Future climate changes are expected to increase the frequency and intensity of coastal hazards, the risk of damage and financial loss. Such changes also present long-term challenges for marina sustainability, asset service life and ecology.
Step 3: Risk Metrics
Step 3 involves converting the damage predicted in Step 2 to standardized risk metrics. Like metrics used by the insurance industry to establish policy premiums, marina damage is defined using specific metrics for the purposes of identifying and quantifying risks, prioritizing risk mitigation measures and assessing benefit-cost ratios (BCR) for proposed resilience improvements.
These include estimated annual damage (EAD) and average annualized loss (AAL). The EAD is the estimated average damage expected on an annualized basis. When the associated damage costs are considered, the EAD is used to calculate the AAL, which is the average amount of financial loss a property or asset is estimated to experience on average annually, weighted by the probability of its occurrence. The marina owner should plan for resilience improvements that will result in AAL reductions that are greater in value than the costs of these improvements, with the remaining residual risk addressed by property casualty or business interruption insurance.
Daniel Stapleton is an engineer and natural hazard risk specialist and the developer of the Resilient Marina program at GZA. Matthew Page is a waterfront engineer, leads GZA’s Waterfront and Coastal Services Group and oversees the design of water-dependent and coastal projects, including marinas. For more information, visit GZA.com

| Categories | |
| Tags |