
Annual Industry Survey Results: Part Two
Published on January 15, 2019


Editor’s Note: Annually, Marina Dock Age magazine surveys marinas and boatyards about occupancy rates, product and service
revenues, gross profits and more. Some of our survey results appeared in the 2018 December Trends issue, and we’ll continue to bring
you more results and deeper analysis all year long.
Respondent Profile
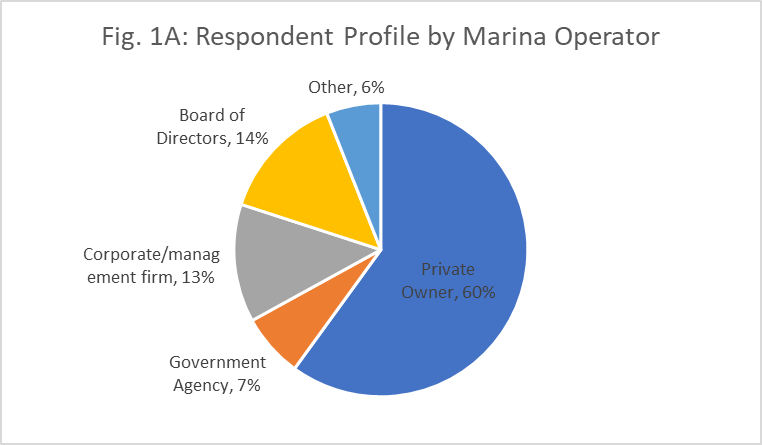
Fig. 1A shows the overall respondent profile by who operates each facility. The majority are operated by private owners (60%). A smaller number are operated by corporate/management firms, board of directors or government agencies.
Fig. 1B shows the respondent profile by facility type. The majority of facilities are marinas with wet slips and dry storage (54%). A large number are also marinas with wet or dry slips and service (39.4%).
The majority of facilities are 26 to 50 years old (41%). A significant number are also 51 to 76 years old (27%), and 24% are 25 years old or less.
Most owners have owned their facilities for more than 20 years (53%), followed by 11 to 15 years (14%); 6 to 10 years (12%); and 16 to 20 years (8%). Only 2% of respondents owned their facility for less than one year (2%).
Occupancy Rate
The majority of facilities overall reported increased 2018 occupancy rates, compared to last year (63%). Those results varied some across the different regions. The West had fewer facilities with increased rates and more with steady rates, compared to the other regions. The South had the highest number with increased occupancy rates. See Fig. 2.
Product/Service Revenues
Fig. 3 shows 2018 revenues, compared to last year, for some products and services. The majority of facilities have steady profits for each profit center, and very few showed decreased profits. In this group of profit centers, haul-out/winterization services had the highest number with increased revenues compared to last year (48%). Boat rentals and used boat sales also had almost 40% with increased revenues.
Expenses
Overall, the majority of facilities are reporting increased expenses (77%). By regions, the West had the largest number with increased expenses (84%), and the South had the least (65%). Most regions had low numbers reporting decreased expenses, and the Northeast no facilities reporting decreases. See Fig 4A.
By facility size, large marinas (with 250 to 750 slips) had the largest number with increased expenses for 2018, compared to last year (86.3%). Small facilities with 99 slips or less reported increased expenses for the lowest number of facilities, and also reported decreased expenses for the largest number of facilities (11.3%). See Fig. 4B.
Gross Profit
Fig. 5A shows 2018 gross profits compared to last year, overall and by type of ownership. The majority shows increased gross profits overall. Corporate owned facilities have a slightly higher number with increased profits (71.4%). Family owned facilities had the lowest number with increased profits and also a higher number with decreased profits (23%), compared to other owners.
The survey also asked respondents to indicate whether or not they were expecting a positive gross profit. The majority said yes (74%). The Northeast had slightly fewer reporting a positive gross profit (52%), and a larger number who were not sure (36%), when the survey was conducted in October 2017. The South and the Midwest had the largest numbers reporting positive gross profits. See Fig. 5B.


| Categories | |
| Tags |