
Demystifying the Significant Wave Height
Published on March 23, 2022


Whenever you hear a marina designer talk about the condition his or her dock is being designed for, or maybe why you need a wave attenuator or breakwater, likely you’ll hear reference to something called the significant wave height. What in the world is that? It says it is “significant” so somehow it must be important, but what does it really mean?
The history of the term goes all the way back to the south Pacific during WWII, when the Marines needed to land on some island. There needed to be some measure to guess how big the waves were on the beach in support of an amphibious landing. So, observers were charged with developing a consistent estimate of just how big the waves were. When correlated to actual measurements of the waves, it turned out to be the average of the highest one-third of all the waves. Why? Well for one thing, the mind tends to erase, or not see all the small waves passing by, focusing only on the more “significant” features of the sea, which were larger. Was there a reason that these waves were in fact more significant? They certainly weren’t reporting the mean or average wave height. They certainly weren’t reporting the Root-Mean-Square (RMS) values of all the waves measured – a value that only means something to a statistician and would have mathematical significance. Nor were they even the biggest waves out there.
No, the wave height reported was just a number that most observers could agree upon that seemed to represent the sea condition they were observing. At its creation, it had no other value than that. Now the idea of thinking in terms of sea state is not a new concept. In fact, many decades earlier there was another “significant” number – the Beaufort scale.
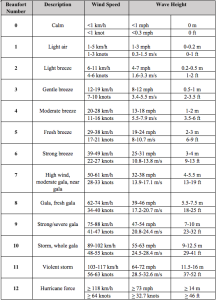
If you talk to hearty mariners today, you will find that they use that as their measure for reporting the sea state. To refresh your memory, the Beaufort scale, shown in Table 1, talks about wind conditions but it also describes the size range of the waves. In many ways, you might argue that it is even more representative of the sea state than the significant wave height number because it stresses the range of wave activity occurring. That is the reality. We are trying to describe ALL the waves, not just one wave. Reporting the significant wave height as if it was just a simple wave does not reveal that same or full level of information. The inconvenient aspect of the Beaufort scale is that its numbers are just sequential and have no dimension, so other than reporting a relative level of intensity, there is no means to translate it into anything else directly useful.
A Different Approach
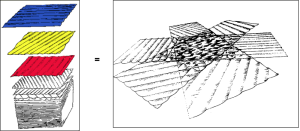
But let’s look at the significant wave height in a slightly different way. Picture the diva at the opera standing on the stage, bathed in white light. Now turn around and look into the rafters and see the spotlights. Notice that the spotlights are not white, but rather they are red, yellow, green, blue, etc. But when they merge on the diva, they become white. Did they suddenly change? No, they combined, and so it is with the sea. There are red waves, blue waves, green waves, and yellow waves, but we see them or describe them as a white wave, which is the significant wave height as suggested by Figure 1. Is there really a wave that is exactly the significant wave height? Well, there could be – but in fact what there really is, is this whole sea of different waves that we are characterizing as one number, this significant wave height number. The danger then becomes that we start assigning a physical property to this significant wave as if it is a real event. In fact, the significant wave height value is exactly the same as the Beaufort scale or any other scale that indicates that there is a clustering of a range of sizes and periods of waves, around some central value. To illustrate this, examine Table 2.
In Technical Terms
I’m going to get a little technical here for a moment, so just stay with me. What the table is giving us is a count of the largest 687 waves found in a collection of 2,000 waves produced in an example storm. The table breaks down the number of waves with various heights, all proportioned to Hs (the significant wave height value), sorted by wave period. So, for example, there were nine waves found that were of a height 25% bigger than the RMS wave height value (5/4Hrms) with a period of 4.6 seconds.
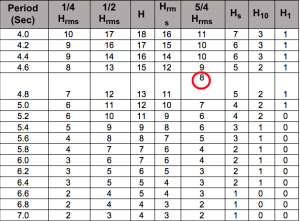
For any of you math geeks, there is a relationship between the RMS wave height value, Hrms and the significant height value, Hs. Statistically, Hrms = 0.707Hs, so 5/4Hrms is nearly the same value as Hs. We have spoken before about the importance of including the wave period when you describe a wave, because waves of the same wave height, but different periods, produce effects that are totally different. All of the waves shown in the table, plus the energy of the unreported smaller waves, are needed to produce the value of Hs, yet there are actually only 54 waves, or 2.7% of the 2,000 waves in the sea state, which are actually (or could be) the same as the stated significant wave height. Not a lot if you think about it. But exploring the table further we see that of that 2.7% population of waves, their wave periods range from 4.0 seconds to nearly twice that period. It’s beginning to appear that maybe this “significant” wave is not really a wave at all, but something else.
Giving physical geometry to a significant wave height value and peak period, as if it were a real wave, grossly misrepresents the wave environment; it is just a statistical artifact. In reality it just describes the product of waves passing through each other from various directions and at different speeds and as such the water surface cannot maintain an identity. Yet to make things simple we treat the water surface as a regimented wave train of just one wave height and period, (called a monochromatic wave) so that there is some deterministic form that can be analyzed.
To further simplify the calculation steps to get a number to use for design, we then incorrectly reinterpret the significant wave height sea state value to be the equivalent of a monochromatic wave of height Hs and period Tp. Just to show how dangerous that is, consider the energy in a wave, which is related to the value of the wave height squared, i.e., E ≈ H2. For a monochromatic wave, Hmono is exactly equal to Hrms of the time series, or E = Hmono2 = Hrms2. But in terms of a significant wave height, because Hmono = 0.707Hs, E = Hs2. In other words, making the mistake of treating the Hs value as being an equivalent Hmono value means you are overstating the energy transfer by a factor of 2. Let’s put that into physical terms. A dock that experiences the force or effect of a boat wake measuring one foot in height, which is essentially a monochromatic wave, would be equivalent to experiencing a storm sea state with a significant wave height of 1.4 feet.
Not All Waves are Equal
So simply put, not all wave environments are created equal! We need to understand whether we are talking about a simple wave, like a boat wake, or a sea of many waves described by some number that we call the significant wave height and then design for those specific conditions. If it is the latter, then we must be prepared that there is some wave in that storm that will be nearly twice as tall, which will affect how strong we need to build our float.
We need to also understand that if we have designed our wave attenuator for a particular wave period value that also characterizes the sea state, then there will also be some waves with periods nearly twice as long. The attenuator won’t stop those long period waves, so our marina may still experience undesirable agitation. It is up to the engineer to appreciate the full meaning and implication of a “significant” wave, and to supply you and protect you with an appropriate solution that considers all the implications. Like the diva on the stage, bathed in the red light, green light, blue light, and yellow light, but appears to be in white light, we may define any sea state by citing a number that happens to have physical spatial units. But in reality, that one number represents all the red waves, green waves, blue waves, and yellow waves that happen to be occurring simultaneously at that location.
Jack Cox, P.E., D.CE, D.PE, D.NE, is coastal engineer at Edgewater Resources. He can be reached at jcox@edgewaterresourcers.com.

| Categories | |
| Tags |