

Designing Marinas is a Breeze
Published on March 5, 2023


When designing a small craft marina, there are no design codes like those for buildings or bridges. There are plenty of theories that have been built upon as time goes on, but a lot of processes in coastal design are still open-ended. This gives designers some flexibility but can be troublesome when other designers have different standards in mind. The two main forces on a dock are wind and waves. Wave loads are calculated with wave parameters such as the height, period, and wavelength of the wave, as well as water depth. This process is largely standardized without much debate on how to find these forces. Wind loading, however, is more nuanced. There are two main ways that wind forces are calculated, but there are flaws in each of them. However, there is a way to modify and combine them for a more accurate method for engineers to use moving forward.
Calculating Wind Load
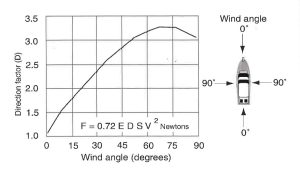
The original method for calculating wind loading on vessels was introduced by Tobiasson and Kollmeyer in Marinas and Small Craft Harbors, 2nd Edition (2000). The second method was introduced in ASCE Manual 50, 3rd Edition (2012). Both methods incorporate wind velocity, and the area of the vessel. The Tobiasson and Kollmeyer method includes a direction factor, which adjusts the end area depending on the wind angle (Figure 1). It also includes a shielding factor, which acknowledges that the first boat receives 100% of the wind load, the following boat receives 50%, and the rest of the subsequent boats receive 30% of the wind load. The shielding and direction factors are not included in the Manual 50 method, but shielding is included in the wind load force equation, after the initial unit pressure equation. Manual 50 includes a drag coefficient, CD, instead of the direction factor. A drag coefficient quantifies the resistance of the boat against air flow on and around it.
The flaw in both of these methods is how the vessel area is calculated. In Tobiasson and Kollmeyer’s method, it is assumed that the end area is 1/3 of the side area of the vessel, which is not always the case. The end area is modified by the direction factor to increase it for beam and oblique winds. The Manual 50 method multiplies the average profile height and the L.O.A. (length overall), and only includes direct bow/stern winds and beam winds, with nothing in between. This method assumes that the average height times the L.O.A. of a vessel will result in the vessel’s side area, which is a bit far-fetched due to the varying shapes of boats, and the fact that they are generally not perfectly rectangular. Incorporating all wind angles is extremely important because it turns out that the oblique wind, from about 15-25° off the direct beam wind, produces the largest force, as this is typically the largest cross-sectional area. Additionally, winds approaching the bow will have a larger force on the vessel than stern winds, due to the shape of boats.
To correct the errors in the area calculation, data was collected to determine relationships between L.O.A., profile, and beam for vessels common to small marinas. The profile of a boat, or distance from the water line to the average height of the top of the boat, is approximately 25% of L.O.A. The relationship between the L.O.A. and the beam (vessel width) depends on the size of the vessel; the beam is about 28% of the L.O.A. for smaller yachts of 25 to 60 feet and about 12% of the L.O.A. for yachts 60 feet long or greater. Additionally, the total area of the vessel was compared to the effective area to develop a block coefficient of 0.65 for the side area of the vessel. The block coefficient for the end area is assumed to be 0.9 in naval architecture.
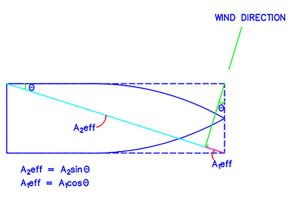
The effective area is then calculated, influenced by the angle of the wind. For example, if the wind is hitting directly on the vessel’s beam or side, the entire side area is used, a direct bow or stern wind will use the entire end area, and anything in between will take a portion of both areas as shown in Figure 2.
Gaythwaite et al. developed a collection of directional component drag coefficients for a range of vessels, which later formed curve fit equations for mean drag coefficient values among other parameters. The values for the lateral drag coefficients were all taken as positive and distinct equations were developed for the minimal conditions to account for differences in the bow and stern geometries. The component drag coefficients were then used to calculate directional wind loads and combined to determine the resultant force.
Wind loads were analyzed in lateral and longitudinal components and combined through vector addition to obtain the net force. The process followed two main methods to allow for comparison: the method provided in ASCE Manual 50 and Gaythwaite’s adaptation of the drag equation. The use of vector addition allowed for the calculation of both the magnitude and the direction of the resultant force. The net force does not necessarily act in the same direction as the wind, as it is a function of vessel geometry.
After obtaining the net force, a value could be obtained for a unified drag coefficient as is typically used. Dividing the force by the effective area, described above, yielded this value. When done for a range of wind angles, comparisons could be made between the results and historically recommended values.
A New Approach
To demonstrate the advantages of the new approach, an example will be worked in comparison with the two existing methods. Consider a vessel of 40 ft L.O.A., 12 ft beam, experiencing loading under a 65-mph wind. This condition is possible during a severe storm event. It is also assumed the wind impacts the boat at an angle of 30˚ from the bow.
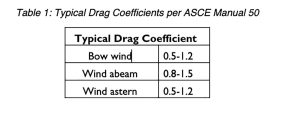
Following Tobiasson and Kollmeyer’s method, Figure 1 can be used to obtain a direction factor of 2.4. (Note: Tobiasson’s method is calculated using metric units, but for the clarity of this comparison, they have been converted to English units). Additionally, using a value of 132 ft2 for end area yields a net force of 4080 lbs. Following the Manual 50 method requires an additional assumption. Rather than determining the drag coefficient as a function of vessel geometry and wind angle, it is selected using the Table 1 under the designer’s best judgement.
Depending on the selected CD value, the unit pressure can vary from 11.6 to 34.9 psf, depending on how conservative the designer wants to be with their calculation. Using end and side areas of 120 and 400 ft2 results in a total wind load of 3525 to 10607 lbs. As mentioned above, these values use the full cross-sectional areas, rather than accounting for block coefficients.
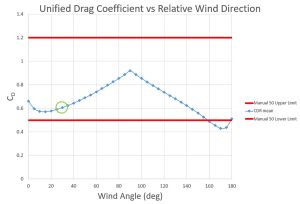
The main advantage of this proposed method combines the directional consideration present in Tobiason and Kollmeyer’s method with the use of drag coefficients in Manual 50. Furthermore, it allows for a better estimate of the drag coefficient based on experimental data presented by Gaythwaite and accounts for block coefficients of cross-sectional areas. Using the approximate 1:4 relationship between L.O.A. and profile, the profile for the example vessel is assumed to be 10 feet. With the calculation of effective area as described in Figure 2 using the block coefficients, a value of 223.5 ft2, rather than 303.9 ft2 as without block coefficients, is obtained. Gaythwaite provides a range of directional drag coefficients as a function of wind angle. The component forces are calculated and summed using vector addition for a value of 5256 lbs. With the resultant force and effective area, a resultant drag coefficient of 0.61 is obtained. The determination of the unified drag coefficient provides useful insights. Firstly, it is based upon Gaythwaite’s data, rather than solely requiring the designer to make an educated assumption. This can allow for a more refined and cost-effective design. Additionally, as seen in this example, the resultant value falls within the range historically used as provided in Table 1. This helps add confidence to the validity of our proposed method, as the values fall within the anticipated range. Figure 3 helps illustrate this point.
Although the two previous methods have been trusted for years in the design world, this proposed method results in a more accurate wind force, which can save money by avoiding overdesigning, or save a dock from failure in a severe storm. The wind isn’t only important for sailboat speed, and schooner or later, a single method for marina design will need to be chosen.
References:
The Task Committee on Marinas 2020 of the Coasts, Oceans, Ports, and Rivers Institute of the American Society of Civil Engineers. Planning and Design Guidelines for Small Craft Harbors. 3rd ed., American Society of Civil Engineers, 2012.
Tobiasson, Bruce O., and Ronald C. Kollmeyer. Marinas and Small Craft Harbors. 2nd ed., Westviking Press, 2000

| Categories | |
| Tags |