
Have Your High Water Pants Ready?
Published on April 25, 2022


Guess what, it looks like Sea Level Rise (SLR) is real. Actually, we knew it was real way back when I was in grad school in the 1970s. Back then we talked about sea-level rise in the range of 2-3 mm/year. But we also talked about what caused that rise. Yes, a warming climate was a piece of it, but we also understood that some of that rise was attributed to the “shoaling of the oceans” with river systems dumping upland sourced soil into the sea, and also just the accumulation of dying marine life – just like dinosaurs of old gave us coal and oil today. On the sea level rise chart I was given, there was even a very small extra line that I was told accounted for the accumulation of fish feces.
Well, all that is still happening today, so even if we managed to stop the warming trend, sea level would still rise. Now there are geologists out there that remind us that the earth’s continental crusts are still rebounding from the massive glaciers of old. The earth’s crust is like a big foam pillow. Once you take the weight off of it, it rebounds back. Of course, all of that happens in geologic time. But a little of what we are measuring now is still tied to that shifting, and in some places the measured sea-level change appears to be dropping – again because the reference point is changing.
So, to discuss sea level rise we need to step back and talk about what really is changing, of which SLR is just one byproduct, we need to talk more of climate change, and what that may entail. Sea level rise, by itself is only relevant to the ocean coast lines. On the Great Lakes, there is no sea level rise. Yes, I did say no sea level rise, but I did not say lake level variations. We will discuss the Great Lakes later. For now, we will focus on the oceans.
Though SLR has been tracked for decades, it was not until the 1990s that much concern developed over the possible impacts it could have on society. A rise of 3 mm/year, or about a tenth of an inch, did not seem like much of an issue to worry about. At that rate, it would take 100 years for level to rise, maybe, a foot. But evidence suggested that the rate was perhaps starting to increase. Scientists gathered and developed some hypothetical cases of global warming and then used that to estimate the rate of glacial thawing and associated flooding of the sea to higher levels. I do not know if Noah was invited to that gathering.
Different Scenarios
Four global warming scenarios were formulated. The labeling of the scenarios was clearly intended to mean something to the researchers, but definitely kept the general public in the dark as to what they really represented. They computed estimates of melting water volumes based on what were called radiative forcing values. They called these Representative Concentration Pathways (RCP) that ranged from 2.6 to 8.5. Simply put, those numbers represent the heat energy being radiated, measured in watts/m2 of surface area. The lower the number, the less radiated heat, and slower melting. Think of those numbers as something like R values for insulation.
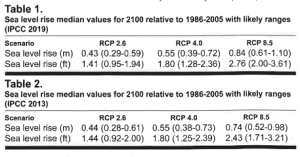
Shown in Table 1 and 2 are projected sea level rise values based on looking at historical records and trying to guess where things are going. Two interesting observations can be made from the tables. First, if you look at the projections to the year 2100, initially projected in 2013 and then revisited with more information in 2019, you will note that the estimates have gone DOWN slightly for the cases of the low to mid-range heating scenarios. But the projection actually went up slightly if you look at the high heating scenario.
So, how do we decide what to believe. That brings us to the second observation. Shown in Figure 1 is the record of sea level rise as compared to the different theories offered up by the scientists over the past 30 years. In the early years, the trends did seem to point to a high rate of Sea Level Rise, but in the subsequent years the data resolved into what appears to be a lower rise rate. That is the problem with trying to make long term estimates based on little actual information. For those of you who are interested in the math aspect of this, generally we are only comfortable projecting out into the future about three times the length of sample you have. So, if we only had five years of sea level data, our confidence in a projection would not extend past 15 years. Now that we have 30 years of trend data, we can project out 100 years.
The measurements seem to say, at least to me, that the lower warming impact scenarios are the reality, whether it be the 4.5 radiated heat case or the 2.6 radiated heat case. Depending on how you want to read the chart, there could be a compelling argument made that the lowest scenario is what Mother Nature is doing, as most of the measurements are even under the lowest curve.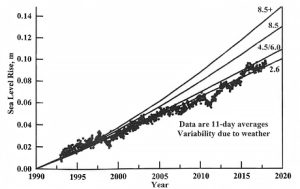
So, where might that put us in terms of Sea level Rise going forward? James Houston, Director Emeritus, for the US Army Research and Development Center, arguably the premiere organization dealing with coastal engineering issues, stated this:
“In the Winter 2016 Coastal Forum, (Shore & Beach) I noted that all U.S. agencies accept carbon dioxide and global warming projections of the Intergovernmental Panel on Climate Change (IPCC), but paradoxically do not accept IPCC sea level rise projections (Houston 2016). Instead, they select sea level rise projections from a variety of publications written by authors not expert enough to be among the 71 sea level rise experts who made the IPCC (2013) projections. This has undercut the IPCC, providing ammunition to climate change skeptics who question the credibility of sea level rise
projections that differ among US agencies and with the IPCC, the international agency whose mission it is to provide sea level rise projections. Adding to the confusion, individual states (e.g. California, Delaware, Maryland, New York) and regions (southeast Florida) have developed their own projections, which are combinations of projections from different publications. These projections do not agree among themselves, with federal agencies, or with the IPCC. This fragmentation contrasts with Europe, where the European Environment Agency (2019) uses IPCC projections for all 16 coastal countries in the European Union.”
His comment and caution seem worthy of respect. There are a lot of opinions whirling around, many based on different agendas rather than pure fact. Here again is a case of follow the science. I choose to believe the RCP 2.6 prediction made by the IPCC, or a rise of about 1.5 feet by the year 2100 along our ocean coasts. Is that an absolute guarantee, of course not. I would be rich if I could prognosticate that well. But an estimate of over 3 feet in sea level rise, currently being considered by many communities, seems excessively high. It can lead to forcing some very awkward and unworkable designs now, just to meet that lofty, highly conservative goal in the future that may or may not be real.
Addressing the Great Lakes
But, I promised we’d also consider the Great Lakes. The Great Lakes is a closed hydraulic system, that although ultimately dumping into the Atlantic Ocean, what the ocean does will not affect the lakes. The St Lawrence River and Niagara Falls see to that. The Great Lakes are actually affected by what happens in the drainage areas circumscribing the lakes, including Canada.
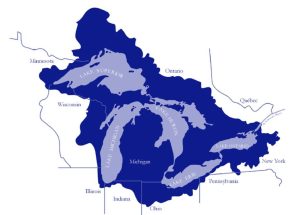
Considering the size of the lakes, it is a surprisingly small area that contributes to the rise and fall of the water levels as shown in Figure 2. Notice that when it rains in Chicago, Lake Michigan basically doesn’t receive it! The Great Lakes lake levels vary with the local hydrology, not world-wide sources as the oceans do. So, if we want to speak of climate change impacts to the Great Lakes, we need to be thinking changes in local weather patterns instead, not just warming or cooling.
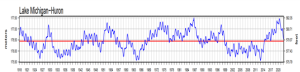
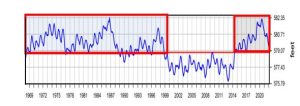
The levels of the lakes have been tracked since before 1900. Figure 3 is a chart of how Lake Michigan-Huron system levels have varied over more recent times. The lakes seem to undergo a cyclic rise and fall pattern, which depending on your view, may be repeating every 20 years or so, ironically similar to sunspot cycles, to secondary cycles that may be of the order of seven years from high to low, with precipitous rise and fall in the lake levels. However, no one has had much success in statistically predicting where lake levels will go.
But, in the recent years we do see some trends, correlating to the time period of climate change study. If we look at what has been occurring since about 1965, in Figure 3, we see that the lakes have been at or above their long term mean level 70% of the time. We are not seeing equal probability of high or low water levels occurring. This has major implications on both the design and resilience of coastal infrastructure, having to perform at the extremes of the lake levels rather than during average conditions. Indeed, this is also reflected in the 30% of the time when the lake level was well below the mean. There again the infrastructure is straining, but in the opposite direction as water levels are then too low to accommodate navigation, and sedimentation of your marina basin is an issue to address.
In Conclusion
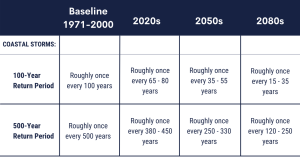
What does appear to be certain is that regardless of Sea Level Rise, or Great Lakes level variations, the coastal waters are likely to experience more severe and extreme events, and more often. Table 3 compares what is expected to be the reality in terms of intensity of storm events as a result of climate change.
The designs of our existing facilities are all based on what conditions were like 30 years or so ago, i.e., the baseline condition used for comparison in the table. The 2020s is where we are now. This chart indicates that a storm event that we considered the 100-year event 30 years ago is now only a 65-70 year event. The 100-year event would be something bigger. Our measurements of storm events confirms that is happening. That also means that instead of one severe event of that magnitude, we might see two, or even three. That slowly, or not so slowly, wears down our infrastructure and so we need to expect more maintenance costs. The table then even warns that in another 30 years, e.g., what you would be designing for if you started designing right now, should really have a design condition even more robust than what the current statistics suggest as we try to prepare for that future condition.
So, what are my prognostications for the future? Plan to hike your pants up to avoid flooding. Don’t throw away your flip-flops, as there will be times when the water goes down and you are then stuck in the sand. And for sure zip up your jacket because the winds will blow harder.
Jack Cox, P.E., D.CE, D.PE, D.NE, is coastal engineer at Edgewater Resources. He can be reached at jcox@edgewaterresourcers.com.
Houston, J, (2020), “New 2019 sea level projections by the Intergovernmental Panel on Climate Change”, Shore & Beach, vol 88, #2.
Intergovernmental Panel on Climate Change, (2013), in Climate change 2013: The physical science basis. Cambridge University Press
Intergovernmental Panel on Climate Change, (2019),”Summary for Policymakers” in IPCC Special Report on the Ocean and Cryosphere in a Changing Climate. https://report.ipcc.ch/srocc/pdf/
Rozenzweig, C. and W. Solecki, New York City Panel on Climate Change, (2010) “Climate Change Adaptation in New York City: Building a Risk Management Response,” Annals of the New York Academy of Science 1196,
University of Colorado, (2021), “Most recent GNSL Release 2021_rel2: Global Mean Sea Level (Seasonal Signals Removed) “ https://sealevel.colorado.edu/.
US Army Corps of Engineers, Detroit District, (2022) “Great Lakes Water Level Data”, https://www.lre.usace.army.mil/Missions/Great-Lakes-Information/Great-Lakes-Information-2/Water-Level-Data/

| Categories | |
| Tags |