
Industry Reports Increasing Occupancy Rates and Gross Profits
Published on November 11, 2019


Editor’s Note: In September and October 2019, marinas and boatyards across the country answered our annual survey about occupancy rates, product/service revenues, gross profits, expenses and more. Additional results from this survey will appear in the January/February 2020 issue. Also, look for the Trends Report in 2020 with up to 10 years of industry trends on the most important business performance statistics.
Respondent Profile
Fig. 1A shows the map of overall respondents to the survey. The regional numbers in this survey report on four areas: West (15%), Midwest (18%), South (44%) and Northeast (23%). Fig. 1B shows the respondent profile by facility type. The majority of facilities are marinas/boatyards with wet or dry slips and service (43%). Fig. 1C shows the survey respondents by ownership. The largest majority are family owned facilities (39%), with private ownership overall representing 72%.
Occupancy Rate
Fig. 2A shows the 2019 occupancy rate compared to 2018, overall and by regions. The majority of facilities have a higher occupancy rate this year, and that number expands higher in the South and West.
Fig. 2B shows the number of facilities reporting increased, decreased or steady occupancy rates, compared to last year, by facility age. Middle aged facilities (11 to 25 years old) have the largest majority with higher occupancy rates, compared to last year. OId facilities (more than 75 years old) have the largest number with stable occupancy rates and fewer with increased rates.
Fig. 2C shows the occupancy rate, compared to last year, by facility size. Rates stayed fairly steady across different sized facilities, with slightly more larger facilities experiencing higher occupancy, than smaller facilities. More smaller facilities also experienced lower occupancy rates, compared to last year.
Fig. 3A shows the 2019 occupancy rate overall and by region. Numbers do not vary significantly from region to region. The majority of facilities are reporting 100 percent occupancy. Fig. 3B shows this year’s occupancy rate by facility age. Younger facilities reported less with 100 percent occupancy, and old facilities had more with full slips. The oldest facilities had the largest numbers with occupancy rates at 95 or above. Occupancy rates for 2019 by facility size are highlighted in Fig. 3C. Small, medium and large facilities had similar occupancy rate numbers. The largest facilities had more with high occupancy number (95 percent and above.)
Rates
Fig. 4A shows the number of facilities reporting increased, decreased or steady slip rates, compared to last year, overall and by region. The Midwest and the West have slightly more facilities reporting increased rates, than the Northeast and South. Fig. 4B looks at rates by facility age. Younger facilities have a much larger majority reporting increased rates for 2019, compared to last year. Fig. 5 outlines 2019 maintenance and repair rates, overall and by region. More facilities reported decreased service rates in the South and none reported decreases in the Northeast and West.
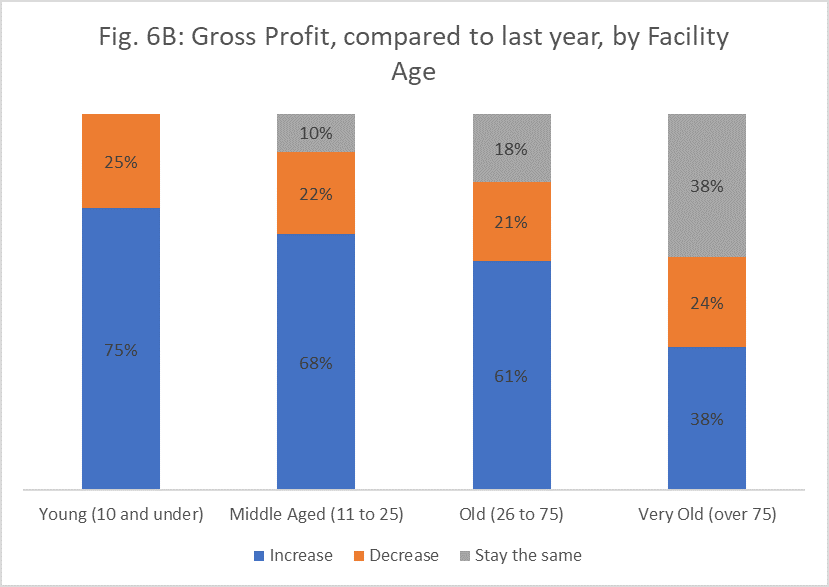
Gross Profit
Fig. 6A shows the number of facilities reporting increased, decreased or steady 2019 gross profits, compared to last year, overall and by region. The majority of facilities report increased profits this year, compared to 2018. Profits don’t vary significantly across the regions. Slightly more facilities in the South and the West reported increased profits. The Midwest reported the largest number with decreased profits.
Fig. 6B shows gross profits by facility age. Younger facilities have a largest majority reporting increased gross profits, and the oldest facility have the most with steady profits for this year, compared to 2018.


| Categories | |
| Tags |