

Is the Goal Wave Attenuation, or is it Harbor Tranquility? – Part Two
Published on March 22, 2021


In our previous article about wave attenuation published in the March 2021 issue of Marina Dock Age we talked about just exactly what was needed to be considered a tranquil basin. We learned that it was not just one number, but in fact it was a function of several factors. One factor was the frequency of which a particular condition was experienced, another how the boat slips were laid out relative to the wave direction, but most importantly, what the wave periods to be encountered were. Let us now explore the implications of those factors.
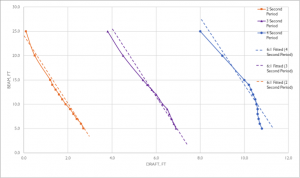
First, we will look at what happens if a wave encounters some sort of barrier. We will make this a partial barrier, i.e., it floats so has a finite draft, or is some sort of wall that does not reach to the bottom. Shown in the first of the set of figures is a depiction of the distribution of wave power in a 2 and 4 second wave in 10 feet of water.
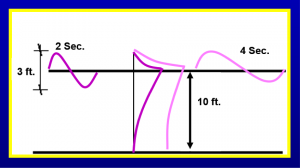
It may be a surprise to some of us that a wave is not just a feature that appears on the surface of the water, but in fact reaches deep down into the water column. If you have ever been to a wave pool and felt your feet suddenly being pulled on by the passage of a wave, you can certainly confirm that. What this figure shows is that the “pull” is significantly greater at the bottom as the wave period (the time it takes between the passage of any two consecutive waves) increases. It increases at the surface too, but if we want to stop the wave from entering our marina, we need to pay most attention to what can go under our barrier.
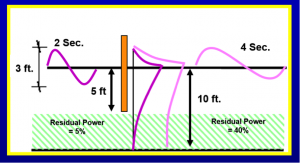
If we now place a half depth partial barrier to try to block the wave from getting past, we see, as depicted in the second figure, that for the 2 second wave, only 5% makes it past, but for the 4 second wave, roughly 40% of the wave power makes it past.
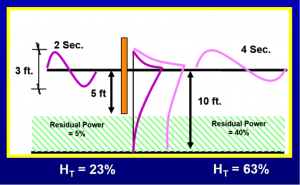
That is certainly a large change in transmitted wave power given that the wave period only went from 2 seconds to 4 seconds! But wave power is not something we can physically perceive, so we can translate that into a measurable wave height as shown in Figure 1c.
For the example shown with an incident wave height of 3 feet, a 2 second wave is reduced to about 0.7 feet behind the barrier, but if that same 3 foot wave has a 4 second period instead, it transmits nearly 2 feet of wave height. So, it is unwise, in fact incorrect and misleading, to talk about a barrier, whether floating or fixed, as having the ability to reduce the size of the transmitted wave based purely on wave height alone. You need to know, and have to ask, what is the associated wave period, so that you can make an informed decision on how best to achieve the tranquility you want. One thing that should be obvious however, is that as wave period increases, the ability of a partial barrier (or floating attenuator) to work effectively trails off abruptly.
Figure 2, adapted by this author from previous work by Gaythwhaite (1990), suggests a general relationship between geometric properties of a partial barrier and the expected wave transmission (Kt = Ht/Hi ).
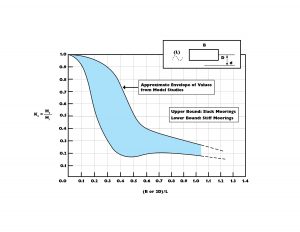
Important to note is that there is a sudden change in efficiency if the barrier width (B) or draft (D) is too small compared to the wave related dimensions like wavelength. In fact, the curve tells us that we need to either make our barrier roughly as fat as half of the wavelength or the draft a quarter of the wavelength to work in the efficient range. That can be huge. Fortunately, we can play with combinations of both draft and width to get the most efficient geometry, which balances the increased mooring force if the draft is deeper to the implications of increased width if the draft is shallower. Regardless, practically, most wave attenuators are functionally limited in application to waves of a 4 second period or less. This is because a 4 second wave, in typical water depths, has a wavelength of roughly 80 feet. This would say that a shallow draft attenuator might then need to be as large as 30-40 feet wide.
Figure 3 presents the approximate relationship of draft to width to achieve the same amount of wave attenuation. The results of a comparative analysis of a
specified transmission or 30% for different draft/beam combinations reveals that for every foot of draft considered, the equivalent damping is achieved by using 6 feet of width. The exact calculation of expected wave transmission is more mathematical than is appropriate here, but can be found, as one source, in Planning and Design Guidelines for Small Craft Harbors, 3rd ed.
As a final comment, the tranquility of a basin is not just a pure one-dimensional transmission past the wave barrier. There can be contributions from waves entering through the marina entrance, waves bending around the ends of detached breakwaters or attenuators, and waves reflecting back from off the shoreline. These can significantly degrade the expected performance of the barrier or attenuator. Shown in Figure 4 is an example summation of all the effects at a location behind a simple wave attenuator.
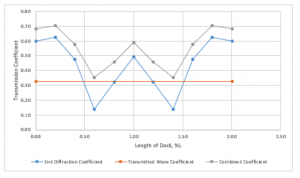
This example examines what is the total agitation level at a point approximately 80 feet behind an attenuator. The simple one-dimensional attenuator transmission, approximately 30%, is shown by the straight red line.
The added contribution of waves bending around the ends of the attenuator are shown in blue. Note that it is not a constant agitation level (varying transmission coefficient) value throughout the basin. The gray line is the resultant composite of both sources of wave agitation. With even a cursory viewing of the results, it is apparent that the actual performance of the attenuation system is 50% to 100% worse than what the attenuator, alone, was supposed to provide.
Now these were expressed just in terms of transmission coefficients, so they do not give the actual agitation levels just the relative conditions compared to the outside. To predict the actual conditions, we have to set what we want as our goal for tranquility based on the boat slip layout, wave period, and frequency of occurrence. Only then can we actually size and configure what we need in terms of length, draft and width of a wave barrier to fully achieve the desired basin tranquility against the coming storm. But be prepared, it probably is a little more than the simple wave wall or attenuator you were hoping for.
The goal is not just wave attenuation – it is harbor tranquility.
References:
ASCE, Planning and Design Guidelines for Small Craft Harbors, Manual of Practice No. 50, 3rd ed., American Society Of Civil Engineers
Gaythwaite, J. (1990). Design of Maritime Facilities. van Nostrand.
| Categories | |
| Tags |