
What’s Mother Nature Been Doing to Us Lately?
Published on January 12, 2021


Maybe it’s just me, but it does seem that over the past couple years we have been experiencing a lot more severe events, whether storm intensity, or extremes in water level changes, sea level rise, numbers of hurricanes, or even delayed seasons. Of course, scientists will argue whether this is the result of climate change or sunspot cycles, or if my impression is even real. For me, and probably for you as it affects our day to day lives, the scientific cause is less important than the reality of “what does that mean for me or what does it do to me.” So first let’s take a swag at my question by first asking “is this real?” My personal opinion is that yes it probably is, but does that mean it will continue that way, I’m not so sure.
Analyzing Statistics
Scientists and mathematicians are really good at computing statistics, but what do statistics really mean? In simplest terms, statistics are just a method of expressing what are the chances of something happening. We use those same statistics to make investment decisions and determine how much risk we’re willing to accept that something will or will not happen. This risk also carries an implicit appreciation of how significant the event or item might be. Typically, something thought of as being low risk usually also equates to something fairly benign. The chances of something going bad are small, or if they do go bad, then there is little value lost.
The proper way of expressing the chance of something significant happening is given as a percent probability. But for most people, that has no physical reality connected to it. A probability of 1% means a 1 in 100 chance of occurring (or 1/100). A 10% chance is 1 in 10, or 1/10. A 4% chance is 1 in 25, or 1/25. But there is no convenient way of associating something physical to that. What does 1% or 10% probability actually mean? So, we flip it and say that something is a 10-year, or 25-year or 100-year event instead. This helps put a tangible “scale” to the risk value. The danger in this, though, gives the false impression that once it has happened, it will not happen again until that labeled duration has passed. If we are going to ask the question properly, we have to specify both the significance level we are interested in, as the speed of a 10-year wind or a 25-year wave height, or the chance of winning a million dollars, etc. Then we also require that it occur during a specific time period we care about. That might be the life of a loan or the lifetime of a person. Winning a million dollars is less important if it happens when we are not around to collect it!
What we really want to do is ask the joint question of what is “the probability of a certain event occurring within a certain time period?” In engineering, we call the latter the design life. It might be the durable life of your dock system, or the time until you can retire or want to sell and get your money back. It can even be looked at operationally as when asking what is the chance of something happening during even a short time period, so you know what immediate action to take. An example could be during construction of your facility when more things are exposed and more sensitive to breakage. There is no fixed number or right number.
Assessing Risk Level
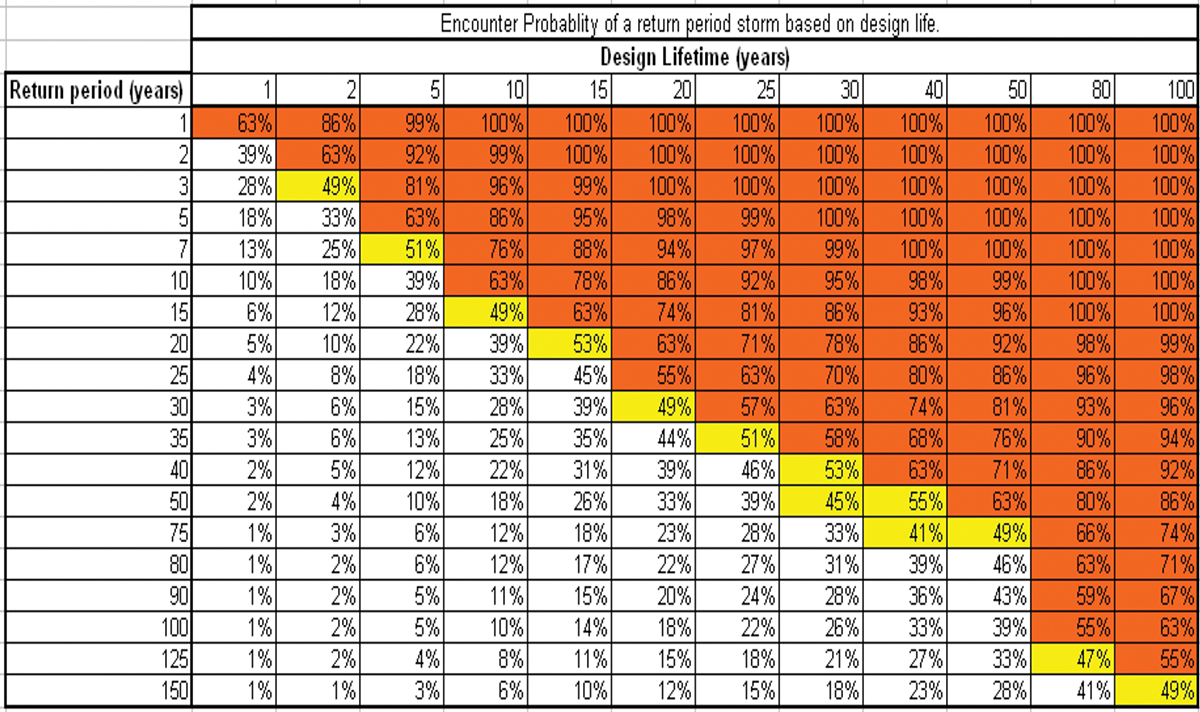
Shown in the table here is a calculation of the probability (risk level) for a certain scale or return period event (call that intensity or importance) occurring within a given time period (design life). You see that it ranges from 100% risk level, down to virtually zero. The combinations of higher (above 50%) probability of return period and design life occurring are highlighted in red. Highlighted as yellow boxes is a diagonal stripe indicating the combinations when the risk is roughly 50%, or a 50-50 chance of occurring. We would like to at least be below that line.
If you look just above that yellow strip of boxes, you will discover that when the design life equals the return period, the probability of occurrence is roughly 63%. It turns out that regardless of the duration or intensity, when the two factors are numerically the same, the probability is basically the same. But more significant is the actual probability number – 63%. It basically says that if you are planning a design life of say 20 years, which might be the life of your dock system, then you have a two out of three chance that you will experience the 20-year wind, or the 20-year wave, or maybe the 20-year flood (whatever your issue is) during that period. If those are events that can break your docks, then that is a concern. If you were going to Las Vegas, those are pretty high odds of winning a fortune, but in the case of your docks surviving to their design life, those are really poor odds! What is even more disconcerting is, if you do further calculations, you will find that in those same 20 years, you have a 30% chance of experiencing the event twice and a 10% chance of it occurring three times.
How to Plan
So, if I have not confused or scared you enough, the question you want to be asking me, the engineer, is “what is the probability I should be planning for?” My answer is of course to reply back asking you how much money you have to risk. Then I want to try and divert the risk selection back to you and make the decision your problem. But that is not very helpful for you. Again, there is no right answer for this but traditionally the convention has been to assume a risk level of no more than 50%. If you need a breakwater, that is an item presumed to be permanent, we probably want the structure to survive at least 50 years. Then, from the table, that means we need to be designing for at least the 75-year storm event, preferably greater. The Federal Emergency Management Administration (FEMA) sets its guidelines for insurance to specify that a 100-year storm intensity be considered. In that case the risk is lowered to 39% for a 50-year life.
But you may have some lesser infrastructure, like your dockage that you do not expect to last 50 years. Or you may have some technology or equipment that may quickly become obsolete and does not justify a long design life assumption. For each of these, with a lesser design life, you would then also have a different return period (or significance level) you would plan for.
In your everyday life you already subconsciously do that. You make a judgment as to whether you are going to put a 50-year roof on your house or a 30-year, probably based on how long you think you will be living there. You decide if the guaranteed 10-year paint is worth the added investment or are you willing to risk the possibility of repainting again in 5 years. If you want to be real analytical about it, you look at the savings you retain by selecting a higher probability of occurrence design, and then see if you are ahead or behind in terms of a return on investment if you put those savings into a rainy day bank account instead and then look at the probability based cost of replacement. In the end, there is no guarantee as there is no limit to what Mother Nature can throw at us. We can only look at historical evidence and make a rational decision based on what information you have. My wife frequently reminds me that you make the best decision you can based on the information you have. Things can and do change as you go forward, but that does not make the decision wrong for when you made it.
Occurrence of Events
But I guess I still have not answered the question I first posed. Are there really more severe events suddenly happening? There is one more aspect of probability that people don’t know much about or think about. But it goes to the heart of the question. It’s called GROUPINESS. Now I am not a probability scholar to explain this in detail but simply stated, it is the concept of whether occurrence of big events and little events tend to occur together or be randomly spread apart. Think of it this way. I have a bag of coins consisting of quarters, dimes and nickels. For the first 10 coins I pull out of the bag, one at a time, I might get a nickel, then a dime and then a quarter, then maybe a nickel then quarter and then a dime and then a nickel, etc., totally random order. Or I might pull out two nickels, then three dimes and then three quarters and then two nickels. The first one seems all mixed up with no apparent trend, while the second one seems to suggest some sort of trend, largely increasing with each coin draw. If I had enough coins, both attempts have exactly the same probability of occurring, but the order is changed when comparing them. That is the effect of groupiness, or lack thereof.
The concept of groupiness is not foreign to us we just associate it with something else. Going back to Vegas, we see things like the roulette table seeming to come up “red” more often or notice someone seems to be on a lucky streak by betting on the same number. However, over the long run, it all works out the same. The danger is in looking at too short of a sample size. In statistics the sample size comes to play in terms of how much information do you need before you can make some sort of reliable prediction. You may think you perceived a trend because you may have only observed 10 or so events. The “house” knows otherwise and looks at the long-term results. Statistical rules say you can only extrapolate out to about three times your sample length. So, if you have, say, 10 years of information, it is reasonable to predict what might happen in the next 30 years, but not the next 100.
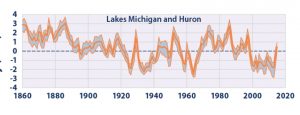
Let’s look at Great Lakes lake levels and see if we can make any predictions of the future based on all this. The US Army Corps of Engineers have been tracking the levels of the Great Lakes for nearly 150 years. Over that time a long term average lake level has been defined and depending on how you chose to look at the data, it appears there is a long term periodicity in shifts from low water of roughly 11 years, and a secondary cycle of roughly 22 years.
Over time, roughly 50% of the time the lake levels have been above the mean and 50% below, as should be expected. In other words, the amount of time the levels are above and below the mean level was more evenly distributed.
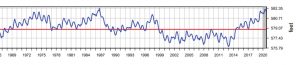
However, if we look at only the more recent history, shown in the second figure, over the past 50 years, Lake Michigan has been at or above mean lake level 71% of the time. Is this an example of groupiness or is it evidence of the possible impact of climate change whose effects were first noticed in the late 60’s and 70’s? If the latter, it could portend that even if extreme lakes levels do not vary greatly above the present record highs, the amount of time the shoreline might be experiencing the side effects of higher water has increased nearly 50%. Because of these prolonged durations at higher water levels, this would be expressed in the form of greater than historic long-term average erosion rates.
We are in a time of what appears to be more frequent, more severe events – more rain, stronger winds, and bigger storms happening more often. Does that mean something has changed, or could it be too, that our current climate is simply demonstrating groupiness that is a natural aspect of probability of occurrence? Extrapolating on only the last 50 years as being more relevant and as best reflecting present climatic behavior, it would appear that we should continue to expect more time when the lakes are higher and likely conditions more severe and extreme. We will have to wait and see if this proves to be true, but for now, as my wife has already counseled, we can only plan based on the best available information we have at the time.

| Categories | |
| Tags |