
Industry Survey State Highlight: Maryland
Published on February 21, 2020


Editor’s Note: For more state results, see Florida on page 30. For more full industry results, visit www.marinadockage.com.
Respondent Profile
Fig. 1A shows Maryland survey respondents by facility type. The majority of facilities (65%) are boatyards and marinas with service and wet or dry slips. Twenty-two percent of Maryland marinas have only wet slips and no service.
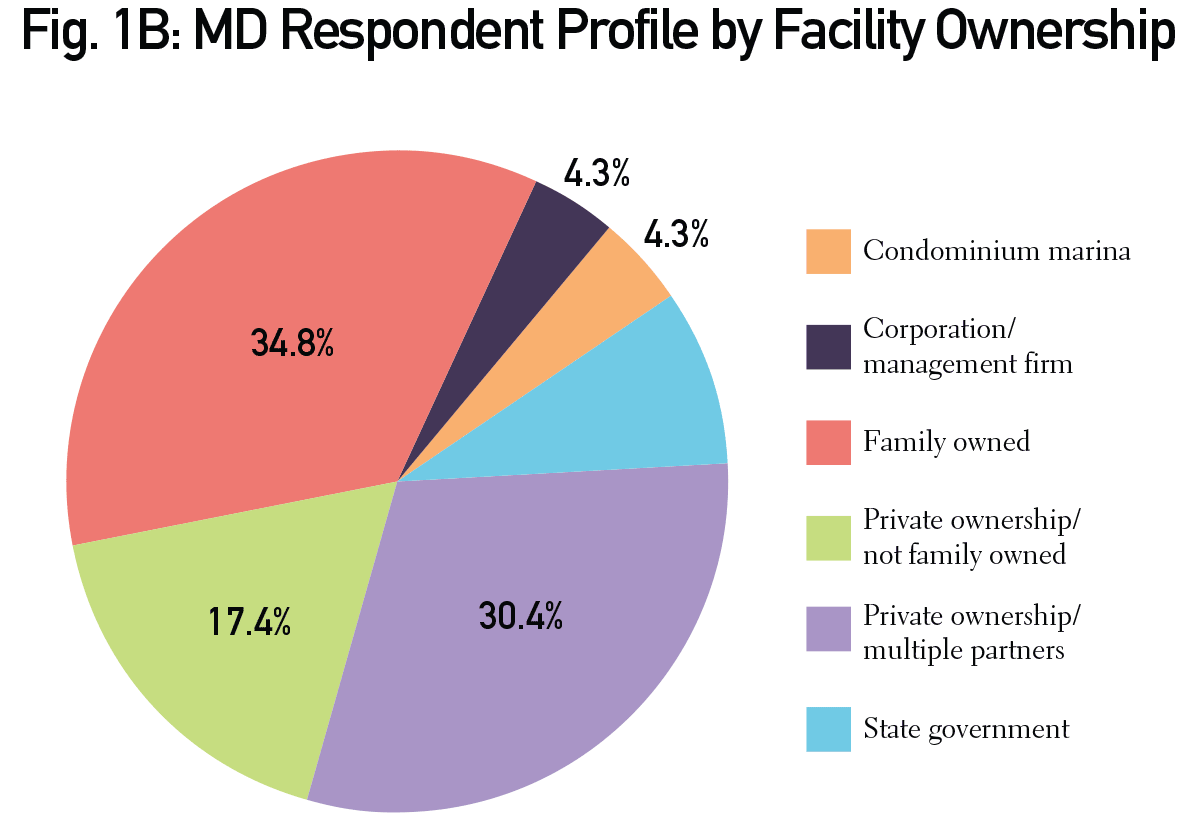
Fig. 1B identifies Maryland facilities by type of ownership. The majority of facilities are family owned (34.8%), private ownership/multiple partners (30.4%); and private ownership, not family owned (17.4%).
Fig. 1C shows the respondent profile by type of facility operator. The large majority (71%) of Maryland facilities are operated by private owners. Corporate/management firms operate 14% of Maryland facilities.
Fig. 1D details Maryland facility age, which varies widely from 10 years or less to 100 or more years old. The majority (34.8%) of Maryland facilities are 26 to 50 years old. Facilities that are 100 years old or more make up 21.7% of Maryland marinas and boatyards.
Fig. 1E represents the Maryland respondent profile by facility size. The majority of Maryland facilities (78.3%) have 249 slips or less. Facilities with less than 100 slips represent 43.5% of marinas in Maryland.
Occupancy Rates and Slip/Maintenance Rates
Fig. 2 shows 2019 occupancy rates in Maryland, compared to the previous year. The majority of Maryland facilities (40%) had higher occupancy in 2019, but 35% also had lower occupancy rates, compared to the previous year.
Fig. 3A outlines Maryland wet slip rates for 2019, compared to the previous year. The same number of facilities (47.4%) reported that wet slips rates increased or stayed the same.
Fig. 3B shows 2019 Maryland maintenance/service rates, compared to the previous year. The majority (50%) report steady rates, compared to 2018.


| Categories | |
| Tags |