
Operations Data Outlines Industry: Dockage Choices, Infrastructure, Employee Training and More
Published on April 11, 2019


Editor’s Note: This follow up survey to the annual industry trends survey looks at topics related to operations and infrastructure, such as dockage offerings and contract terms and lengths; employee training; dredging and natural disasters; and amenity infrastructure and renovations.
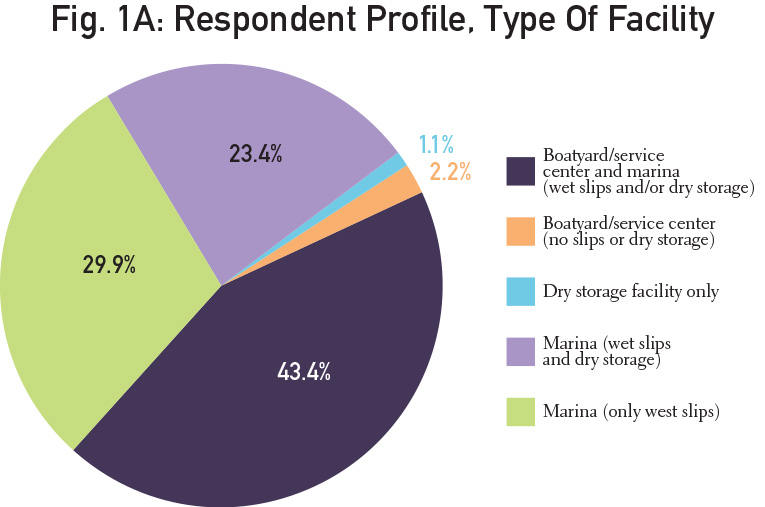
Respondent Profile
Fig. 1A identifies the respondent profile by facility type, and Fig. 1B identifies facilities by ownership. These numbers represent the overall respondents for the survey.
Dockage Offerings, Terms and Charges
Fig. 2 shows the overall number of facilities that offer each type of dockage (slips, side-tie, moorings, uncovered dry storage, covered dry storage/racks and indoor dry storage) and storage breakdown by type of ownership. The majority of facilities offer slips (72%). A large number also offer side-tie dockage and dry storage. Government facilities offer more mooring
fields than private or corporate owned facilities and less dry storage overall.
Fig. 3 reflects the various types of dockage terms that marinas offer. The largest majority of facilities provide transient dockage. A large number also offer seasonal and annual dockage terms. Those number are also fairly consistent by type of ownership.
Fig. 4 shows how facilities charge for dockage (by slip size, by boat size or flat fee), overall and by type of ownership. The majority of marinas charge by boat size. A large number also charge by slip size. More corporate owned facilities charge by boat size, compared to other ownership models. Government facilities also have a large number that charge by boat size, but
the majority of private and family owned facilities charge by slip size.
Fig. 5 shows the largest boat sizes that facilities can accommodate, overall and by type of ownership. The majority of facilities overall take boats up to 40 feet, followed closely by facilities that accommodate boats up to 65 feet. More corporate and privately owned facilities offer accommodations
for boats up to 65 feet and more family owned facilities cater to boats up to 40 feet.
Environmental Factors
Fig. 6 shows how often marinas dredged at their facilities. Close to half (44%) do not need to dredge at all. About 16% of facilities have dredged only during renovations or expansions or only as funding permits. Close to 13% of facilities dredge about every five years.
A variety of natural disasters impact marinas, as shown by Fig. 7. The majority of facilities are impacted by hurricanes (37%), followed closely by ice and winter (29%) and wind (26%) storms.
Fig 8 shows the number of facilities that are Clean Marina certified or in the process of certification. More than half of the respondents (51.4%) indicated that they were Clean Marinas with another 12% in process for certification.
Amenities
The survey asked marinas to identify what amenities they offered boaters and the age of the infrastructure. Fig. 9A shows only those respondents that identified their infrastructure as original equipment, showing the age of that equipment. The percentage shown after each category indicates what percentage of the respondents did not offer that type of infrastructure.
Fig. 9B shows the facilities that identified their infrastructure as not original or renovated and how long ago the infrastructure was renovated.
Training Frequency
Fig. 10 shows the different types of employee training offered at facilities, the overall number that offer that training and how often the majority of facilities offer that training to employees.


| Categories | |
| Tags |