
2018 Survey Results Show High Occupancy Rates and Revenues
Published on November 15, 2018


Editor’s Note: Marinas and boatyards across the country answered survey questions about their occupancy rates, revenues, expenses, gross profits, rates and more. A selection of the statistics are available in this issue. More will be published in the January/February 2019 issue and on our website (www.marinadockage.com).
Respondent Profile
Fig. 1 shows the number of facilities that answered in each region. Regional statistics will be shown in four regions: West, Midwest, South and Northeast. The top states by respondents include: Florida (70%); Maryland (6.1%); California (5.2%); Rhode Island (5.2%); and North Carolina (3.9%). The survey did not have respondents from D.C., Kansas, Kentucky, Louisiana, Mississippi, Montana, Nevada, Oklahoma, South Dakota, Vermont and Wyoming.
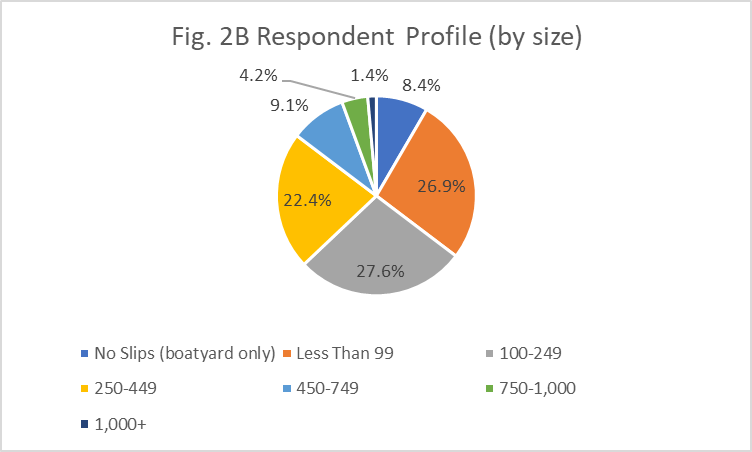
Figs. 2A and 2B show the respondent by facility size and by ownership. The largest number of facilities are family owned (41%); another 12.2% are privately owned, but not family businesses, and another 19.8% are privately owned with multiple partners. Government owned facilities represented 12.8%. Corporate management firms represented 6.3% of facilities and the rest included dockominiums and yacht clubs.
The respondents represent a wide variety of facilities in terms of size, or number of slips. More than 76% of facilities have 449 slips or less. The smallest majorities of marinas have more than 1,000 slips. See Fig. 2B.
Occupancy Rate
Fig. 3A, 3B and 3C look at overall occupancy rate percentage. Fig. 3A shows the overall occupancy rate for the whole industry and by regions, which fairly closely mimics the overall numbers. Fig. 3B shows occupancy rate percentage by ownership (government, family owned, private and corporate. Fig. 3C shows occupancy rate percentage by facility size, or number of slips.
Product/Service Revenues
Fig. 4A, B, C, D, E and F represent some of the product/service revenues – leased slips, transient slips, fuel, dry storage, boat clubs and boat repair/maintenance. A large number of facilities reported increased revenues from leased slips in all regions, compared to last year. See Fig. 4A. The West had the largest number of facilities with increased transient slip revenues. See Fig. 4B. The Northeast and Midwest had fewer facilities with increased fuel revenues. See Fig. 4C. The South had slightly more facilities with increased dry storage revenues, compared to the other regions overall. See Fig. 4D. The large majority of boat club revenues remained steady and none had decreased revenues. See. Fig. 4E. Boat repair/maintenance revenues showed big increases in the West. Also, a large number of facilities had increased revenues, compared to last year. See Fig. 4F.
Fig. 4G shows some of the overall revenues, compared to last year, for other products and services – restaurant, ship store, new boat sales, used boat sales and boat rental.
Expenses
Overall the majority of facilities, more than three-quarters, had increased expenses, compared to last year. Only a small number (6%) had decreased expenses. See Fig. 5.
Gross Profits
The majority of facilities expect to make a gross profit (74%). See Fig. 6. The majority of facilities also had increased gross profits in 2018, compared to last year. Most of the regions show similar numbers. See Fig. 7A. Gross profits varied more based on the size of facilities. A smaller number of small facilities (with 99 slips or less) reported increased gross profits; medium-sized facilities reported a slightly higher number with increased profits, followed by large facilities. Facilities with more than 750 slips had the largest majority with increased gross profits. See Fig. 7B.


| Categories | |
| Tags |